| ||||||
|
You may redistribute this newsletter for non-commercial purposes. For commercial use contact jack@ganssle.com. To subscribe or unsubscribe go here or drop Jack an email. |
||||||
| Contents | ||||||
| Editor's Notes | ||||||
|
Tip for sending me email: My email filters are super aggressive and I no longer look at the spam mailbox. If you include the phrase "embedded" in the subject line your email will wend its weighty way to me. |
||||||
| Quotes and Thoughts | ||||||
|
A good programmer is someone who looks both ways before crossing a one-way street. - Doug Linder |
||||||
| Tools and Tips | ||||||
|
Please submit clever ideas or thoughts about tools, techniques and resources you love or hate. Here are the tool reviews submitted in the past. Grant Beattie wrote:
You don't need a big machine to run Linux. This fellow booted it on a 4-bit 4004 processor. Alas, it takes 4.76 days to boot up! |
||||||
| Pandora's Box | ||||||
|
The recent examples of exploding pagers should resonate with embedded developers. Anything with a connection, even for common over-the-air updates, can be compromised. We've long been warned about actors modifying chip designs for nefarious reasons, but in the past mostly worried about information security threats. Adding explosives - and the required firmware modifications - is not that technically difficult. A battery is an energy storage device where we often want the maximum energy in the smallest space, pretty much the definition of a bomb. In not a few cases we've seen lithium ion devices cause fires and other mayhem. I can think of several ways a malicious actor could, with pennies of hardware, harness that destructive potential. (To avoid giving ideas to bad guys I won't discuss how one could go about any sort of embedded system modifications that could inflict harm, either here in the Muse or via email.) The world is full of state and non-state entities with plenty of money and technical sophistication, sometimes coupled with blind hatreds. Our systems can be compromised despite efforts to secure them. Alas, experience shows it's naive to expect security that is close to perfection. When I was a youngster nothing was connected, other than the black rotary-dial telephone. The most advanced electronics in a home was a TV with 17 or 18 vacuum tubes. Today a web of wired and wireless pathways with hugely sophisticated electronics ties billions together. It seems that web is a trigger. I don't know what the answer is, but am afraid that with the best of intentions we've inadvertently opened Pandora's box. |
||||||
| More on Engineering Notebooks | ||||||
|
Peter Nink responded to Muse 498's take on engineering notebooks:
Carl Dreher wrote:
Vlad Z commented:
|
||||||
| Continuous Observability | ||||||
|
I asked Percepio for a short article about their Continuous Observability product, as it ties in with my belief that we need to employ metrics to understand how our systems are doing. Here's their thoughts: Continuous Observability: Shaping the Future of Embedded Systems Development The failure to effectively manage the complexity of modern embedded systems can have serious repercussions, particularly in industries where system reliability is critical. Here are just two examples of high-profile incidents that underscore this point: • A leading automotive company had to recall over a million vehicles produced between 2020 and 2022 due to a software and sensor issue that could potentially interfere with airbag deployment. • In 2018, a major medtech company faced an FDA-enforced recall of insulin pumps after a cyber vulnerability was found, potentially allowing attackers to remotely control the devices. These incidents not only cost the companies involved a significant amount of money but also emphasized the growing challenges in developing and verifying software for modern embedded systems. To address these issues, the concept of Continuous Observability has become increasingly important. Observability in software systems refers to the ability to assess a system's internal state by analyzing its outputs, such as logs, traces, and memory dumps. Historically, observability has been reactive, with developers using debugging tools when issues arise. However, this approach falls short in handling sporadic problems or those occurring outside controlled environments. Continuous Observability takes a proactive stance, where data collection is automated by default, ensuring diagnostic information is always available for analysis when needed. This approach spans the entire product lifecycle, from early development to post-deployment in the field. By integrating automated monitoring with continuous observability, issues like hidden bugs, performance bottlenecks, and system anomalies can be identified much earlier. Today's embedded systems often integrate multiple software functions through multithreading and asynchronous events, creating unpredictable variations in execution. Connectivity at the edge further increases system complexity and exposes these systems to cyber threats. On the upside, greater connectivity also opens the door to over-the-air (OTA) updates and remote observability. Introducing Observability-Driven Development (ODD) Observability-Driven Development (ODD) is emerging as a key approach to managing the growing complexity of embedded systems and it aligns seamlessly with Percepio's Continuous Observability tools. ODD integrates observability into every phase of the development cycle, providing real-time visibility into system behavior from initial software development to post-deployment through software tracing. Adopting ODD allows developers to detect and address potential issues early, preventing large-scale recalls or delays. Continuous Observability provides ongoing insights into system performance, helping developers identify anomalies, optimize efficiency, and ensure the safety and reliability of their products, even after deployment. Looking Ahead Implementing ODD requires a "shift left" strategy, where observability is built in from the early stages of product design to support all subsequent phases of development and maintenance. The key question is no longer whether developers should adopt Continuous Observability and ODD practices, but how and when to do so. Percepio offers a comprehensive Continuous Observability solution through its tools: Tracealyzer for development, Detect for system testing, and DevAlert for post-deployment monitoring. These tools are scalable across a wide range of systems, from small IoT nodes to powerful multicore SoCs, and provide real-time insights into the behavior of complex embedded software. This enables developers to accelerate debugging, enhance product quality, and reduce deployment risks throughout the entire product lifecycle—even after deployment. Begin Your Observability Journey Today We have a special offer for Embedded Muse readers: sign up for Percepio's newsletter and we will give you a FREE 3-month Tracealyzer subscription. This offer expires on 31 October, so don't hesitate too long. More info here. |
||||||
| Monitoring Power Use | ||||||
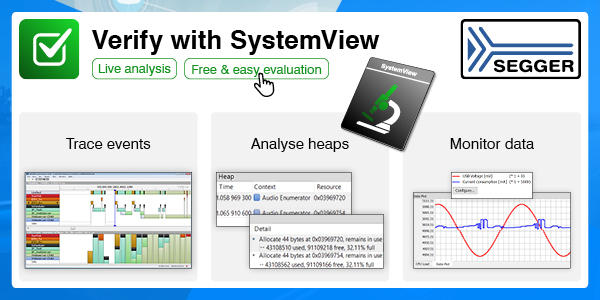
SEGGER's SystemView is a tool I've used that now monitors, among many other things, a system's power use. I haven't tried it for that application, but have found it invaluable for monitoring operation of many aspects of multitasking systems. It's free for non-commercial use and evalutation purposes. More info here. As the low-power article on my web site is one of the most popular downloads, I've asked SEGGER to write something about using the tool for power monitoring. Verifying power use in embedded systems with SystemView's Data Recording feature When it comes to mass programming target devices in production environments, SEGGER's Flasher in-circuit programmers are known for their reliability. These tools ensure that firmware is loaded accurately and efficiently, making them a top choice for high-volume programming. To maintain this level of reliability, SEGGER's SystemView, a real-time recording and visualization tool for analyzing embedded systems, plays a crucial role by monitoring multiple system processes and providing detailed insights into system dynamics. The tool helps to optimize embedded software, pinpoint inefficiencies, and fine-tune task scheduling. SystemView also offers a Data Recording feature that assists developers in verifying data dependencies with system reactions. Let's dive into how the Data Recording feature helps engineers gain a clearer picture of what's happening under the hood. Monitoring the power dynamics and system behavior of a flash programming device While the Flasher's operation is straightforward, its internal processes are quite complex. To ensure these processes work as intended, SystemView provides insights beyond what a standard debugger can offer. One parameter set that provides useful information about the internal processes is the voltage and power use of the target system being programmed by the Flasher. The Flasher firmware continuously monitors voltage and power, using this data to protect the system from overload and to monitor and ensure successful programming operations. With SystemView's Data Recording feature, you can easily log and display these values in the DataPlot window. Instead of relying on a single snapshot, you can now visualize how power parameters change over time. The programming process starts with switching the power supply on and it ends with switching it off. When the actual data is written – programmed – to the device, the measured values of the power supply change as well. All of these events can easily be spotted in the data plot. When relating the data to the events occurring at the same time, you can determine whether any other tasks are interfering with the power-switching and programming operations. Additionally, you gain insight as to whether optimal voltage conditions are maintained, ensuring the reliability of the programming process. Analyzing events and task execution SystemView also captures task execution, interrupts, and function calls. Its visualization capabilities make it easy to follow the entire flash programming process, even without looking at the source code. You can track everything, from the moment a button is pressed to data processing, programming, verification, and completion. The event trace generated by SystemView lets you confirm that the system is behaving as expected, helps ensure that task communication is occurring smoothly, and enables you to spot any task-prioritization issues or delays that might be slowing things down. This kind of insight allows you to tweak task scheduling, reduce unnecessary overhead, and keep everything running efficiently. Optimizing development and debugging When it comes to system verification and optimization, SystemView makes life easier by giving you a high-level overview of system behavior. You can quickly understand how tasks interact and how the system is operating, without having to dig through lines of source code. This is especially useful for identifying timing issues or performance bottlenecks, speeding up your development process, and cutting down on manual debugging |
||||||
| Failure of the Week | ||||||
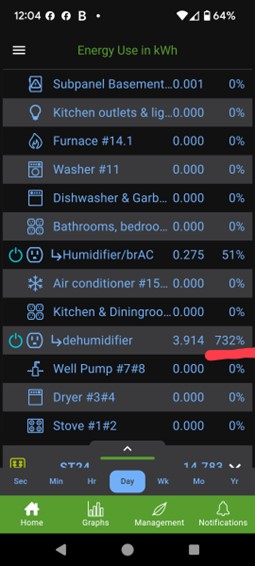
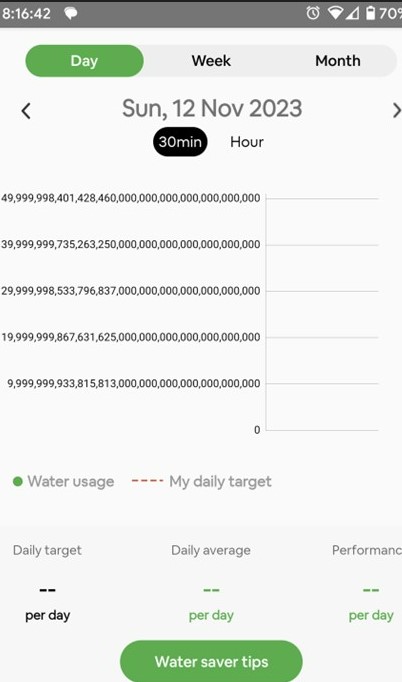
This is from Marc Fain, who writes: Just learned that my dehumidifier is drawing 732% of my energy. This data is from my Emporia energy monitor. A lot of the energy readings are 0.000kWh so figured I should add some context. As you can see from the screen shot, the time is 12:04 (PM) and the time interval selected is day. This is important and plays into the failure because it is showing total energy consumption for the day, which had only accumulated data for 4 minutes so far, thus readings for devices that were not running during those 4 minutes are zero. Not shown, when I scrolled up to the top, was "Total Usage 100%", which by definition is correct. Doing a little investigative math one can see that the total energy would be 0.275kWh/51% = 0.275kWh/0.51 = 0.5347 kWh. Doing the same math on the humidifier yields 3.914kWh/732% = 3.914kWh/7.32 = 0.5347 kWh. That matches, which tells me the total kWh used to calculate the percentages is consistent. Yet somehow the kWh measurement for the dehumidifier (3.914 kWh) is greater than my total energy consumption (0.275 kWh). So the obvious conclusion is that the humidifier is stealing energy from my neighbors! Here's Donald Bailey's water meter report: |
||||||
| Jobs! | ||||||
|
Let me know if you’re hiring embedded engineers. No recruiters please, and I reserve the right to edit ads to fit the format and intent of this newsletter. Please keep it to 100 words. There is no charge for a job ad.
|
||||||
| Joke For The Week | ||||||
These jokes are archived here. What's a computer's favorite pop star? - A Dell What's a pirate's favorite programming language? - R What's an optometrist's favorite programming language? - C# What's IKEA's favorite programming language? - Assembly |
||||||
| About The Embedded Muse | ||||||
|
The Embedded Muse is Jack Ganssle's newsletter. Send complaints, comments, and contributions to me at jack@ganssle.com. The Embedded Muse is supported by The Ganssle Group, whose mission is to help embedded folks get better products to market faster. |


