IAR's I-jet Power Debugger
By Jack Ganssle (Reviewed March 2012) Summary: Jack has been evaluating tools for monitoring current consumption of low-power systems. Here's another.
I've reviewed a number of devices for measuring power here. Ultra-low power consumption is a hot trend, and, happily, more tools are coming to market to help us.
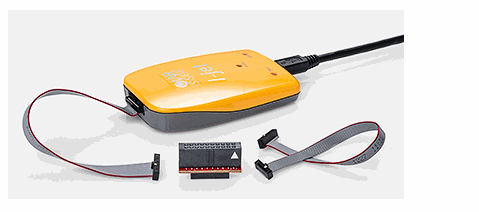
IAR - the folks that make compilers and IDEs - also sells a range of debug probes. Their I-jet is a $300 probe targeted at ARM processors that have a JTAG or SWD (serial wire debug) port. It provides all of the usual resources for debugging embedded systems in the code domain - breakpoints, watchpoints and the like - via a quite intuitive IDE.

I did write rather a lot of code to understand the I-jet's behavior, and found that these standard debugging features worked extremely well. But in this article the focus will be on the device's current monitoring feature.
The I-jet couples code to current. But first, one clarification. IAR's literature talks about its power-profiling abilities. These do not exist. The device measures current, not power. And really, in many cases we're not interested in power but want energy: power*time, which indicates how much we've sucked from a battery. One of my few beefs with the I-jet is its inability to measure energy. A nifty improvement would be to figure watts and then integrate that over some user-defined range to compute the total milliamp-hours consumed. A capacitor might be needed to integrate between samples, but everything else would be, as they say, "just a software change."
First, the specs: The I-jet is powered via USB and in turn sources power (up to 400 mA) to a target board. I'm told there will be a way to measure current on boards with their own supply later this year. It can resolve to 200 uA at a 200 KHz bandwidth.
200 uA to 400 mA is better than a three order of magnitude range. But really low power systems that have sub-uA sleep numbers will be hard to monitor. The I-jet's ADC has 8 inputs so I wonder if a future version will offer a lower range.
The bandwidth is much greater than that of the previous tools I reviewed. But it is much too narrow to monitor instruction-level current changes, though in reality those may get swamped out by decoupling capacitors on the target board.
(A note about bandwidth - some commenters to my previous articles seemed to miss the point that measuring to sub-microsecond rates is tough. Fast ADCs can be expensive, but beyond that, the gain of op-amps degrades as the signal's frequency increases. The amplifier's gain-bandwidth product tells us at what frequency the gain is unity; if 1 MHz, then count on only a gain of 10 at 100 KHz. A lot of gain is needed since the IR drop across the sense resistor is tiny at low currents. Check out this to see some typical gain-bandwidth products. Sure, there are plenty of fast op-amps available, but cost and complexity increases.)
The displayed resolution is 1 uA, which is somewhat deceiving. I think this is a mistake that can mislead developers - or is it a clue about a future enhancement? The numbers highlighted in yellow are typical. Note that the 200 uA resolution means the two right-most digits are meaningless and the third is optimistic:

Presumably there's a sense resistor in the line to the target. Running a program that alternately added and removed a 15 mA load resulted in about 20 mV difference in supply voltage to the board, suggesting a sense resistor of an ohm or two.
At first I couldn't get the I-jet to work at all (a cockpit problem), so popped off an email to the FAE. Bam! Maybe two minutes later he responded with the solution.
ARM processors have an optional macrocell that can sample the program counter at a high rate of speed, time-stamp each sample, and spit the results out the serial connection. The I-jet sets up this resource and then monitors the resulting data, at the same time sampling current. Though the I-jet has a 200 KHz bandwidth, the useable resolution may be lower depending on how fast your board can push packets out. On my 72 MHz board it was very reliable at 70k samples/second, but faster data gathering led to overflows on the serial interface. That's about 14 us/sample. Fast events (again, assuming they are not integrated to oblivion by decoupling caps) could be missed.
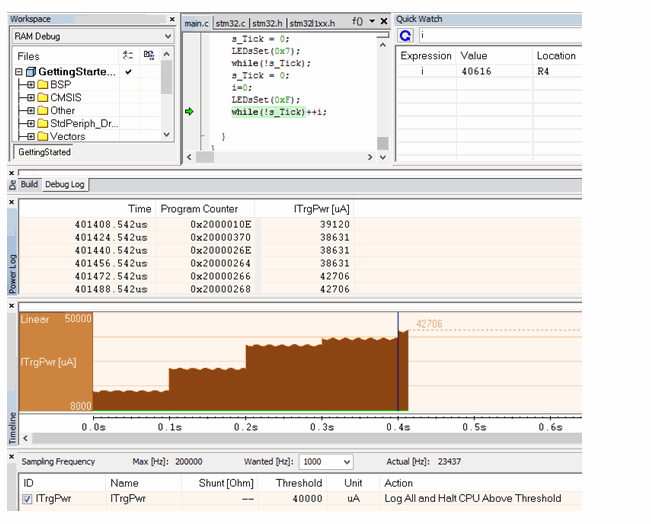
The "power" debugging is fully integrated into the IDE. It's easy to set a breakpoint to stop execution when the current exceeds or is under any value. Or, one can graph current consumption and display it in a list. Double-click on a point in the graph and the IDE highlights the corresponding code in the C source and disassembly windows.
Here's an example:

The graph shows the current going up in steps, since at each step another LED is getting turned on. The bottom window shows where I instructed the IDE to breakpoint if the current exceeds 40 mA. That happens just after calling LEDsSet to put 0xF out, turning on the final LED, pushing power to (see the current log, middle window) 42706 uA. The "while" is highlighted as that's where the current jumped to over 40 uA. Notice the "skidding" in the graph - the power went above the break value and the code continued to run for a while. Indeed, variable "i" in the watch window has incremented 40616 times after the break should have happened (it's a register variable so, at the CPU's 72 MHz, things are happening fast). Using the time stamps in the current log window it turns out the skidding lasted 12,625 us. I'm guessing the I-jet, or perhaps the PC, gets a signal that the break condition has occurred, and then sends a break command to the CPU.
The skidding, though, turns out to be mostly unimportant since the code aligns almost perfectly with the current graph and log; looking back in the current log at the time stamps and PC the current jumped no more than 16 us before the first execution of the "while", which is about the resolution of the sampling interval. The skidding makes for a bit more work for the developer, but it's so easy to navigate in the graph window it's not much of a pain.
Oh, and the graph just screams - it's really fast, and is displayed even when the code is executing. You can select the display resolution in increments from 10 ns to an hour.
So much data winds up in the log window that it's cumbersome to move around in it; I'd like to see a search feature. There's a lot of wasted space to the right of the log window's data; a cool feature would be to annotate each entry with the code that was executing.
Somewhat analogously to the Real-Time Current Monitor the IDE will display current either linearly or logarithmically. The latter is hugely important to profile a system's overall operation over a wide dynamic range. For instance, this is a linear display:

The same data in log form shows much more detail:

The screen can get really busy with various windows open. I wish one could "undock" windows from the IDE and move them around on the desktop, which would use a multiple-monitor environment much more effectively. The I-jet is a big advance in monitoring current in low-power systems. It's easy to use and provides phenomenal insight into a system's operation in the current domain. If you're working with an ARM-based device that has energy constraints, this is a must-have tool.
I'd like to thank Shawn Prestridge of IAR for his help with this article.

